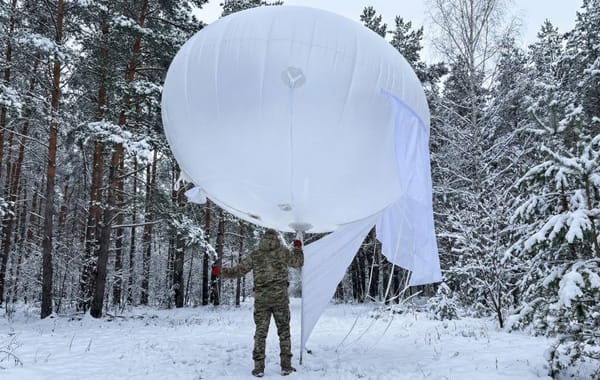
Visualising Radio Horizon from an Aerostat

When explaining aerostat-based RF infrastructure to clients, one concept comes up every time: how does radio horizon change with altitude?
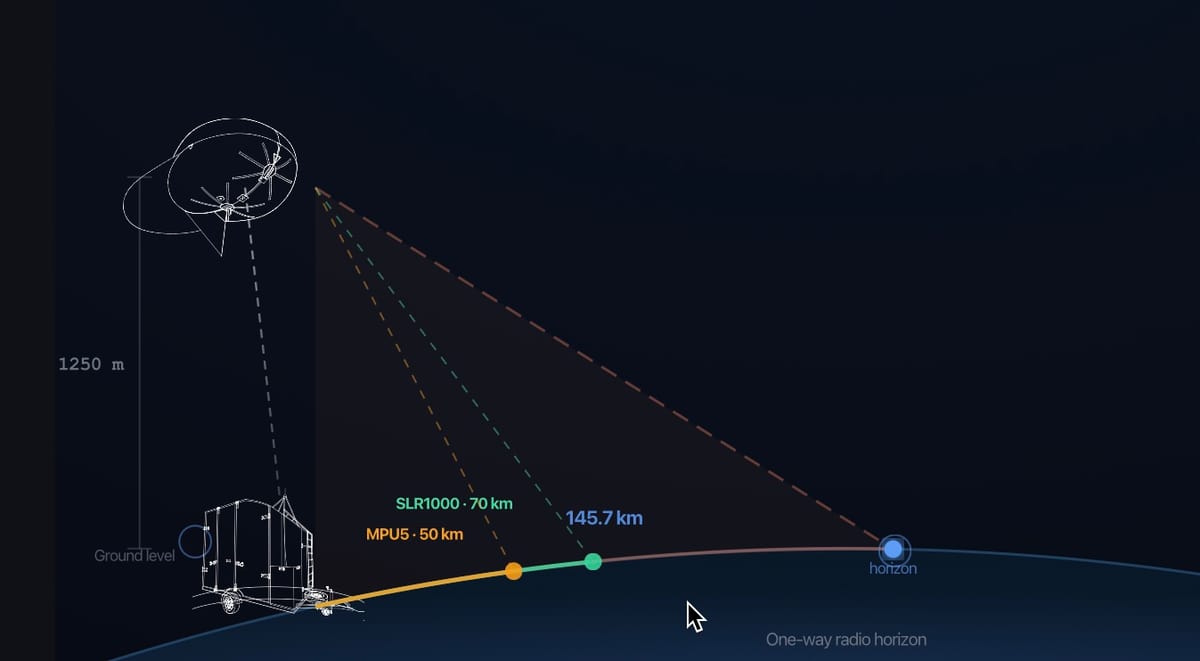
The physics is straightforward — lift a relay higher and the line-of-sight footprint grows. But showing that relationship in a way that's quick to grasp has always been harder than it should be. We've accumulated a lot of real-world data on different systems and their reach from different altitudes, and turning that into something visual meant a lot of manual work.
So we built this calculator. Move the slider, see the horizon change, toggle the radio systems you're interested in.
You can try it - link below
A few things worth knowing before you dig in: all reach figures are measured using omnidirectional antennas. Directional antennas, terrain, weather conditions, and system-specific configurations will all shift the numbers — sometimes significantly. Think of these as solid baselines, not guarantees.
That's crazy that you can make such interactive visualisations in few ours using Claude.